


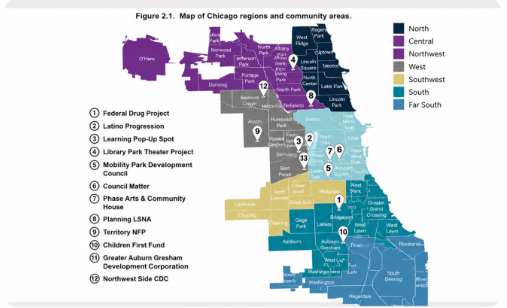
Program progression vs. proposed timeline with status indicators across a 3-year horizon.
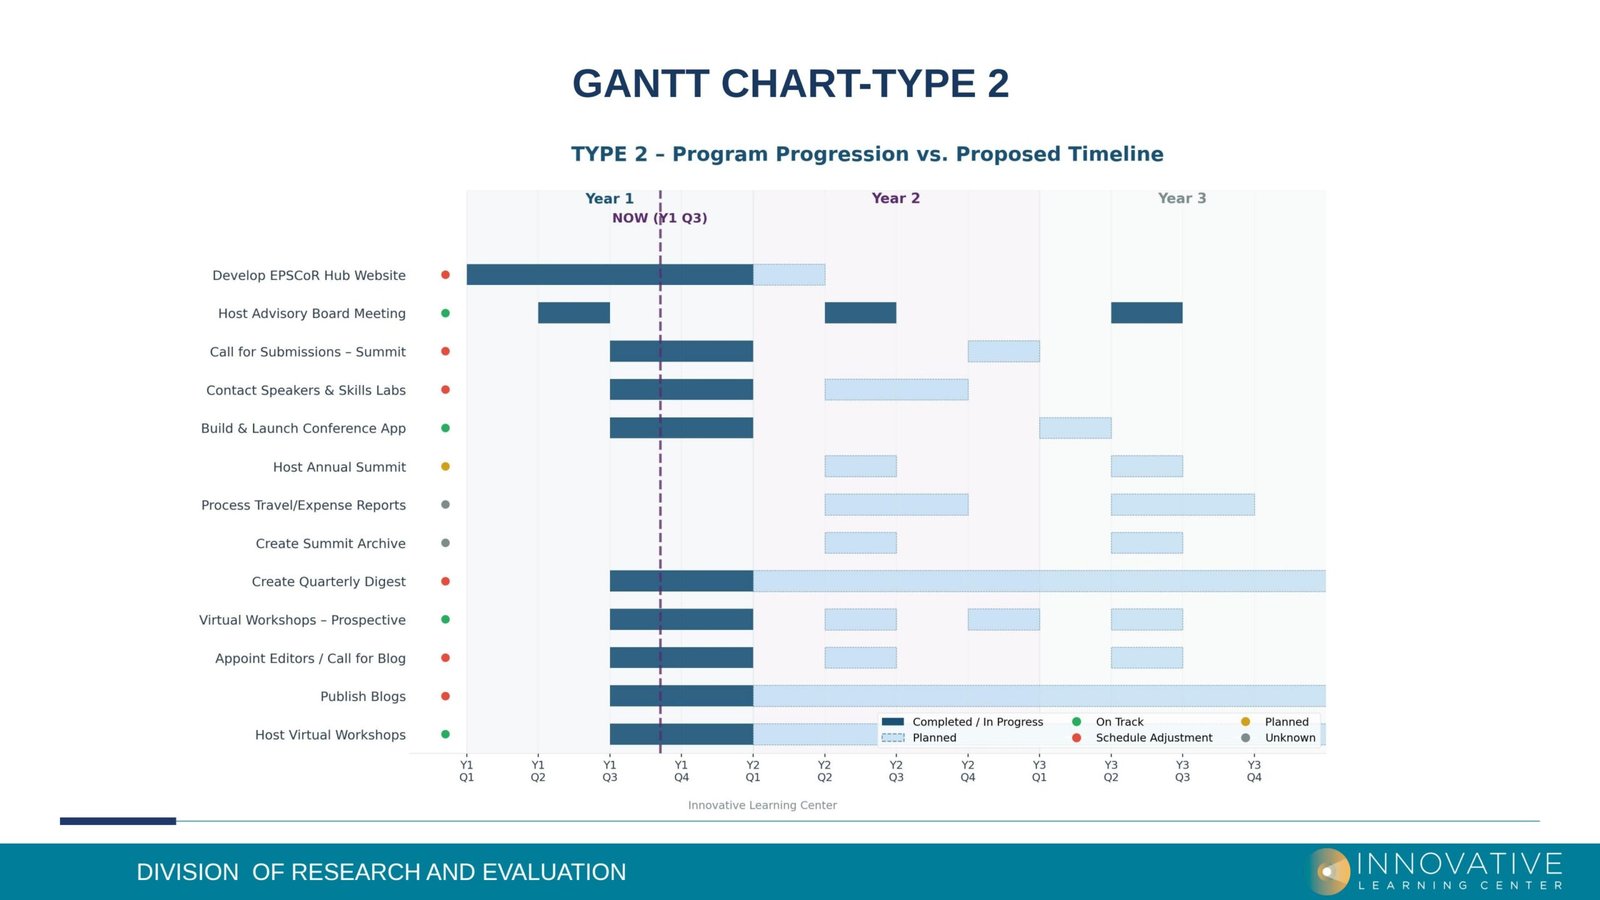
Beta and p-values for predictors of math self-efficacy displayed as a color-coded heatmap.
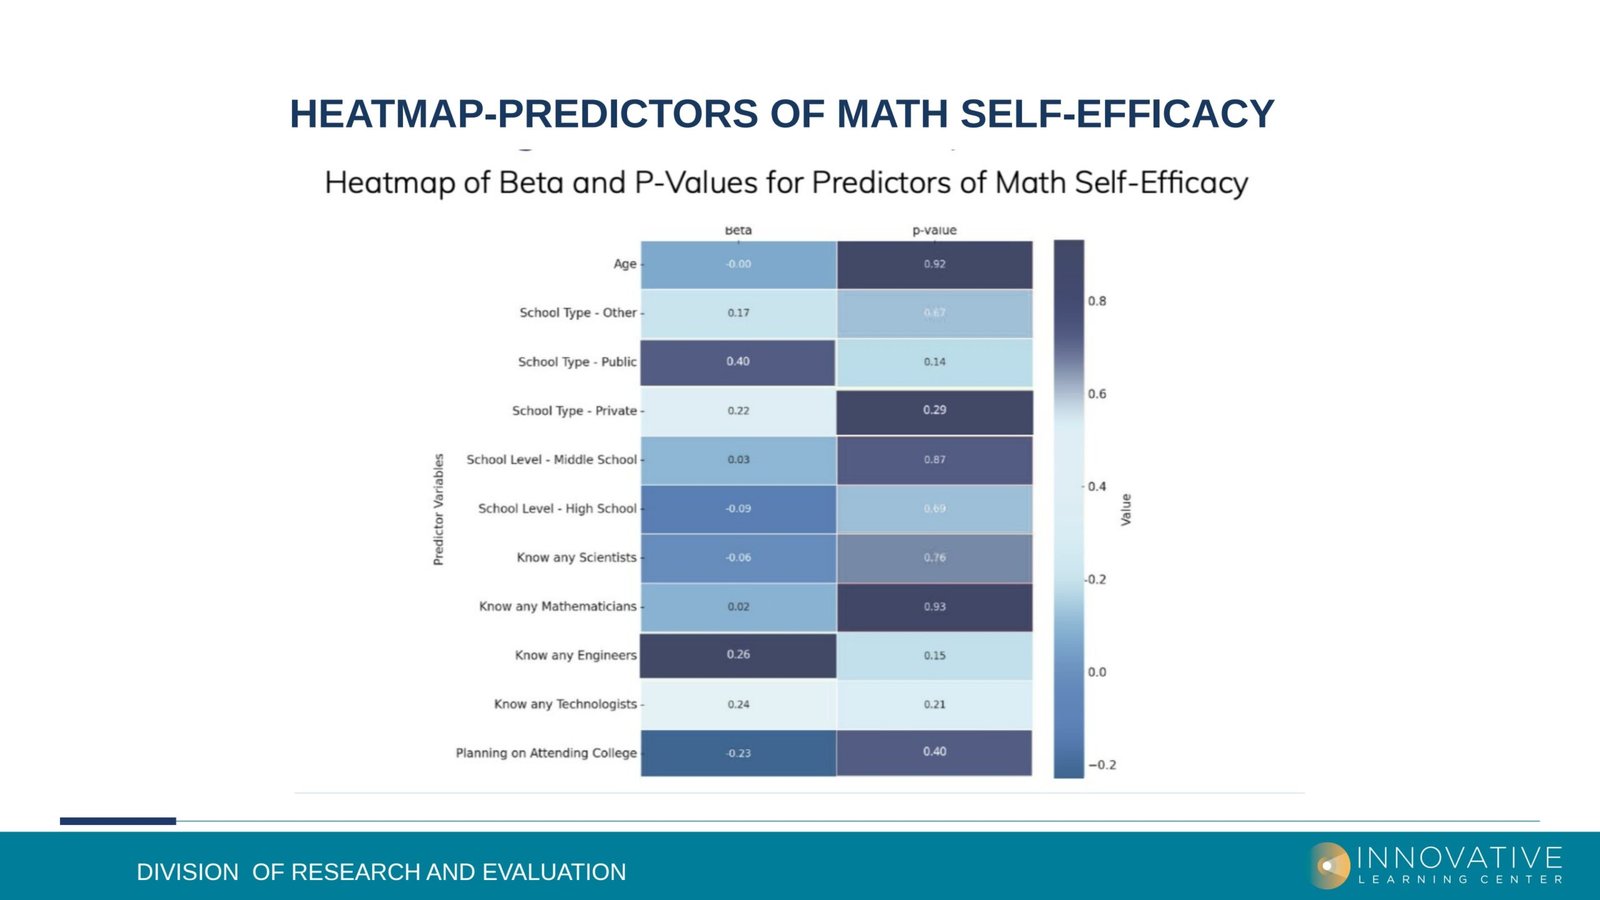
Post-survey response distribution showing agreement levels across 11 program questions.
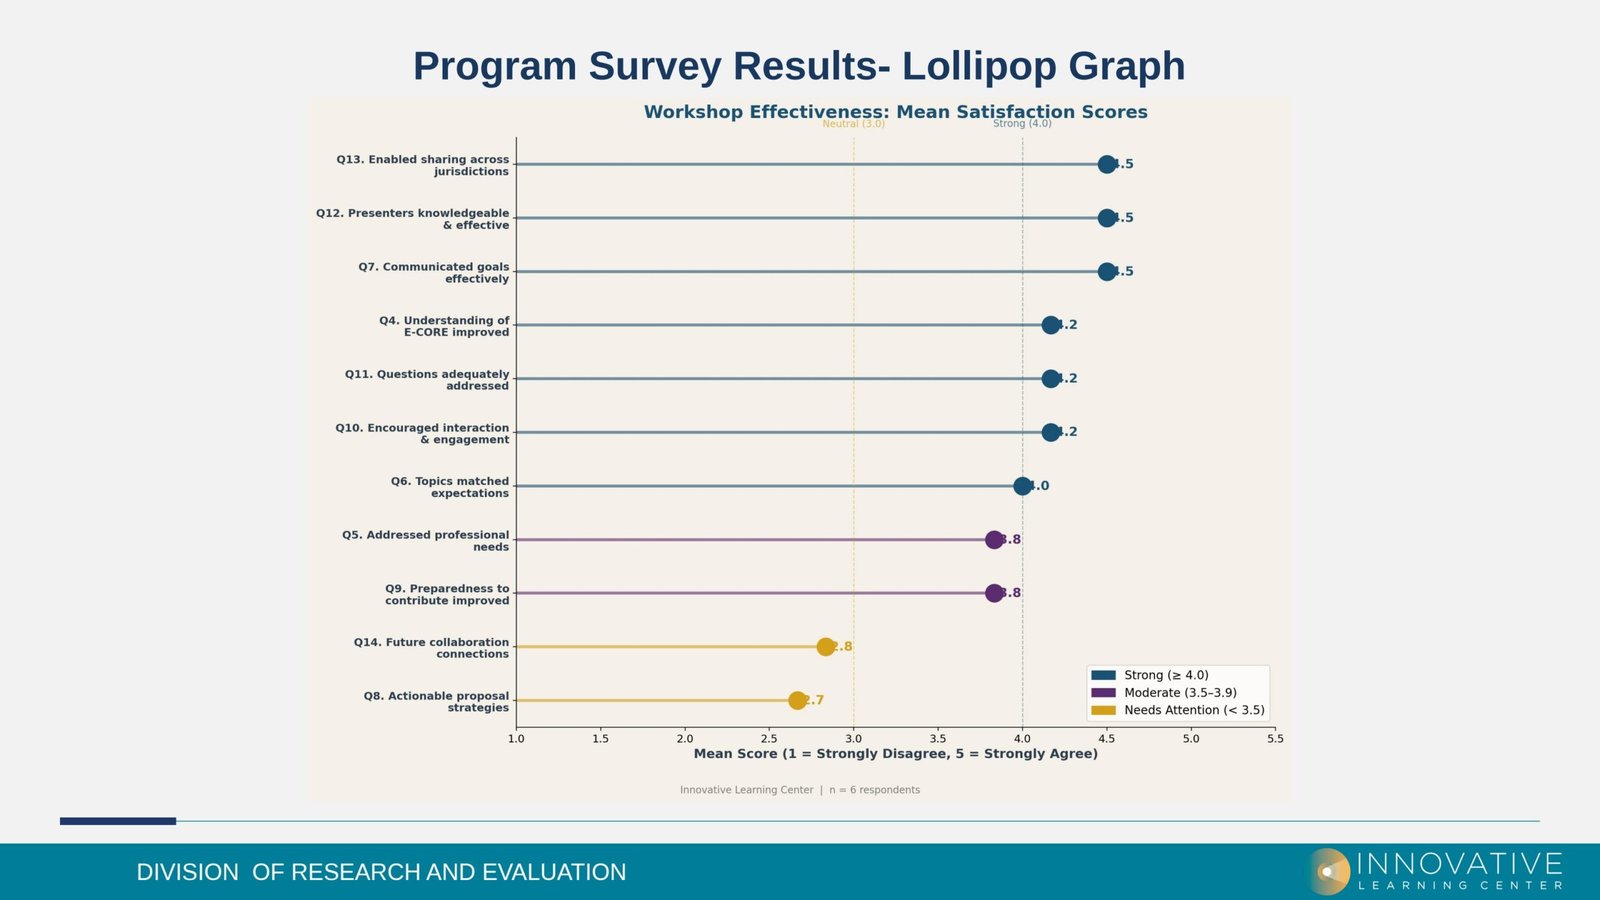
Mean satisfaction scores with color-coded strength categories.
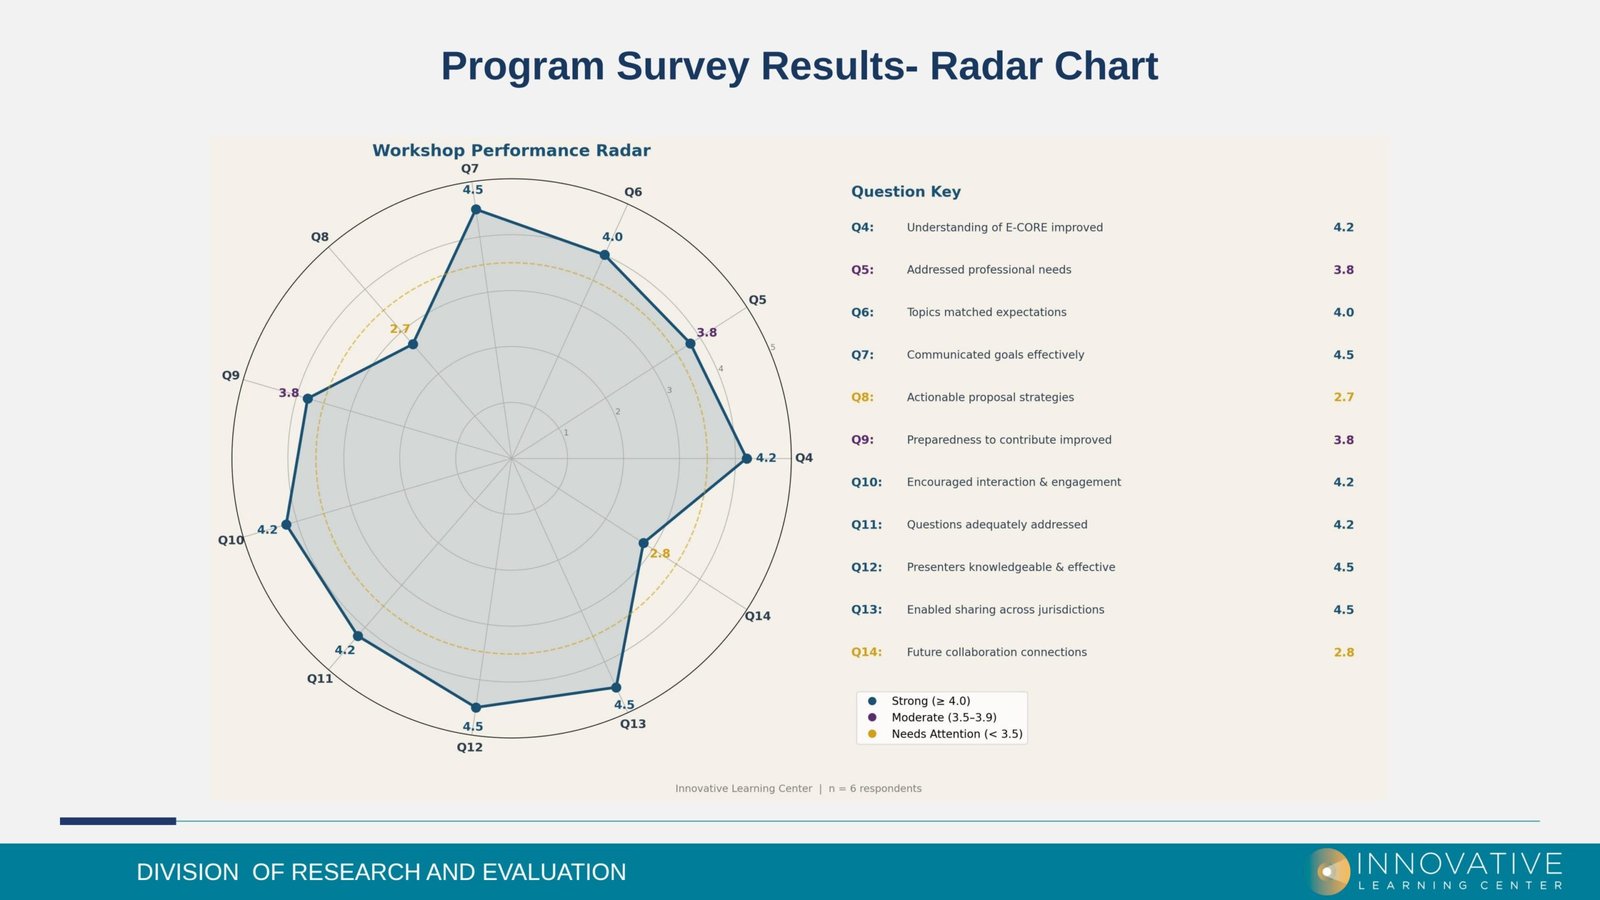
Multi-dimensional workshop performance radar with question key and color-coded legend.
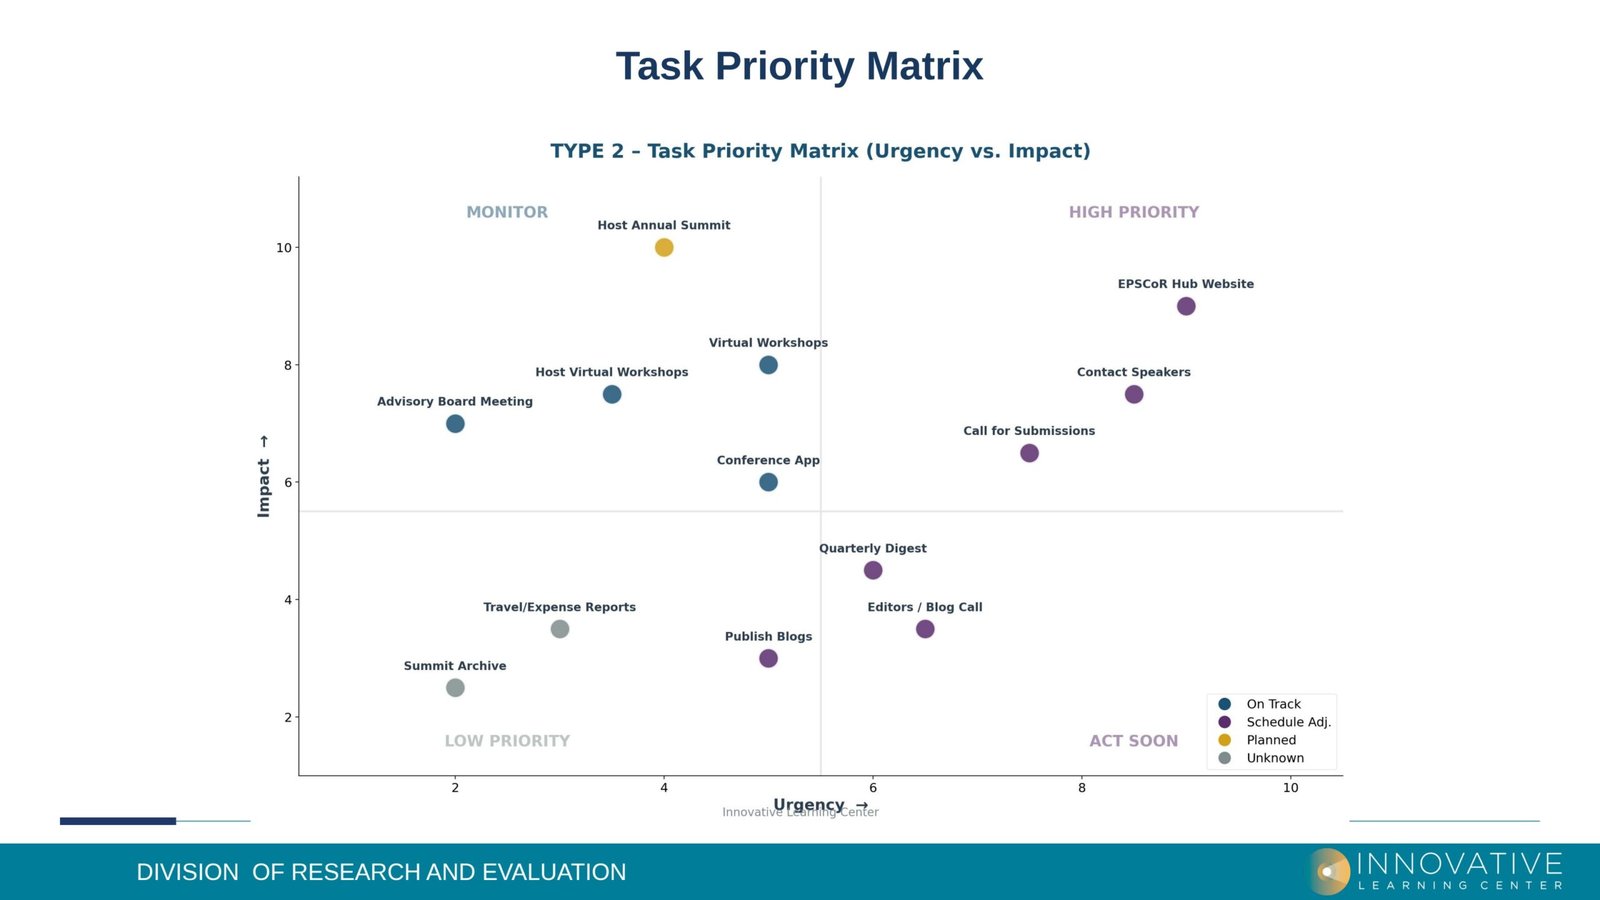
Urgency vs. Impact scatter plot categorizing tasks into priority quadrants.
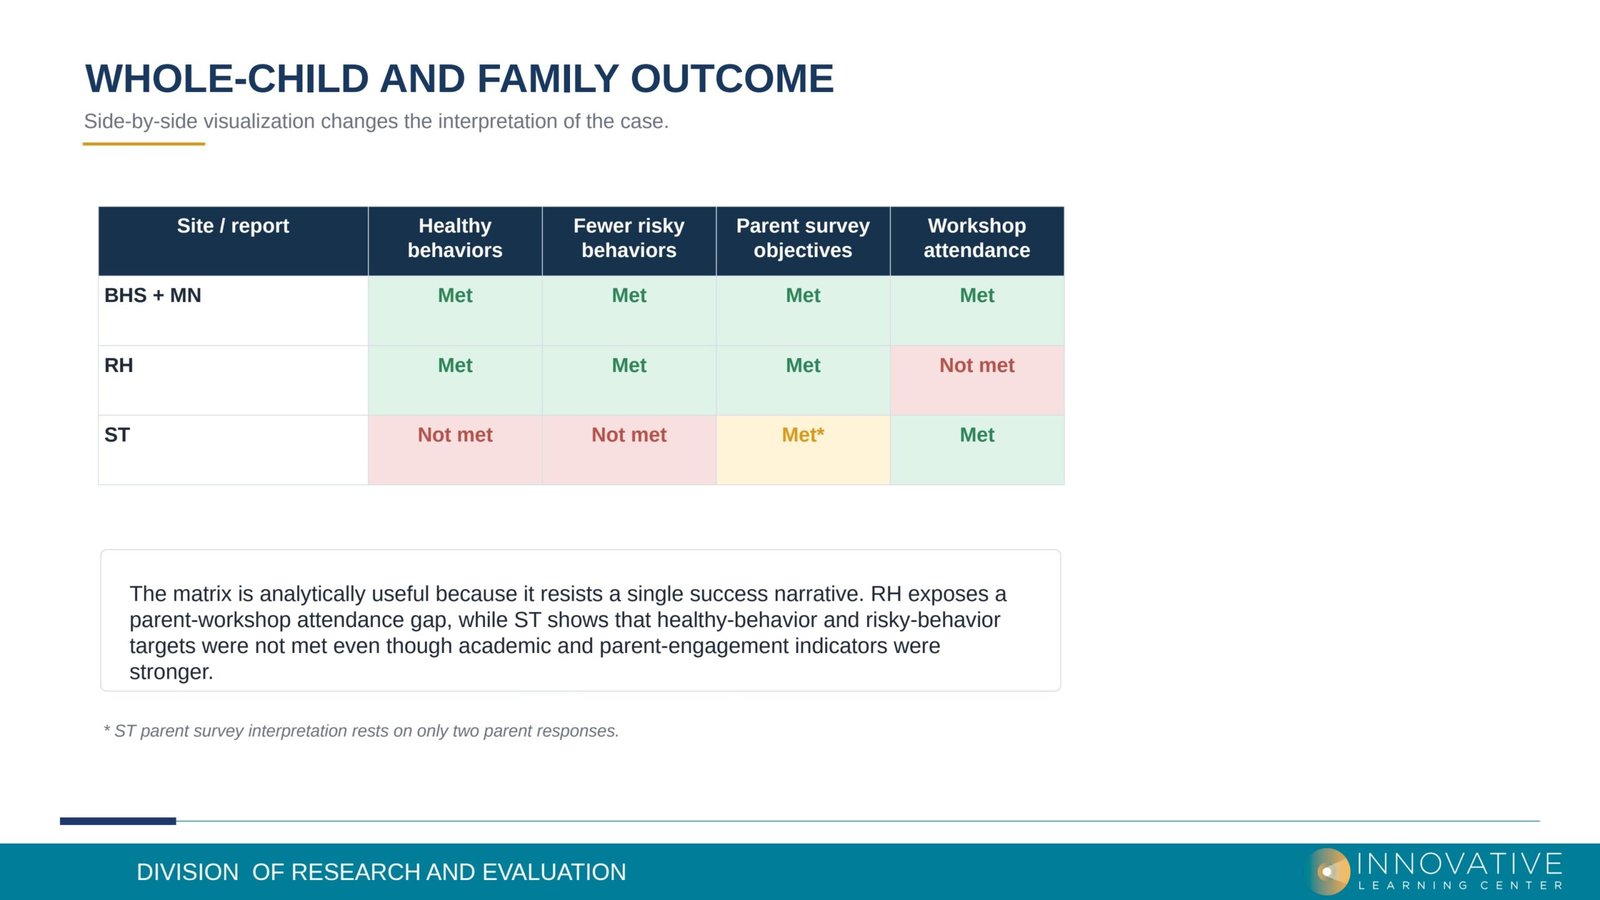
Side-by-side outcome visualization across sites showing met/not-met indicators.
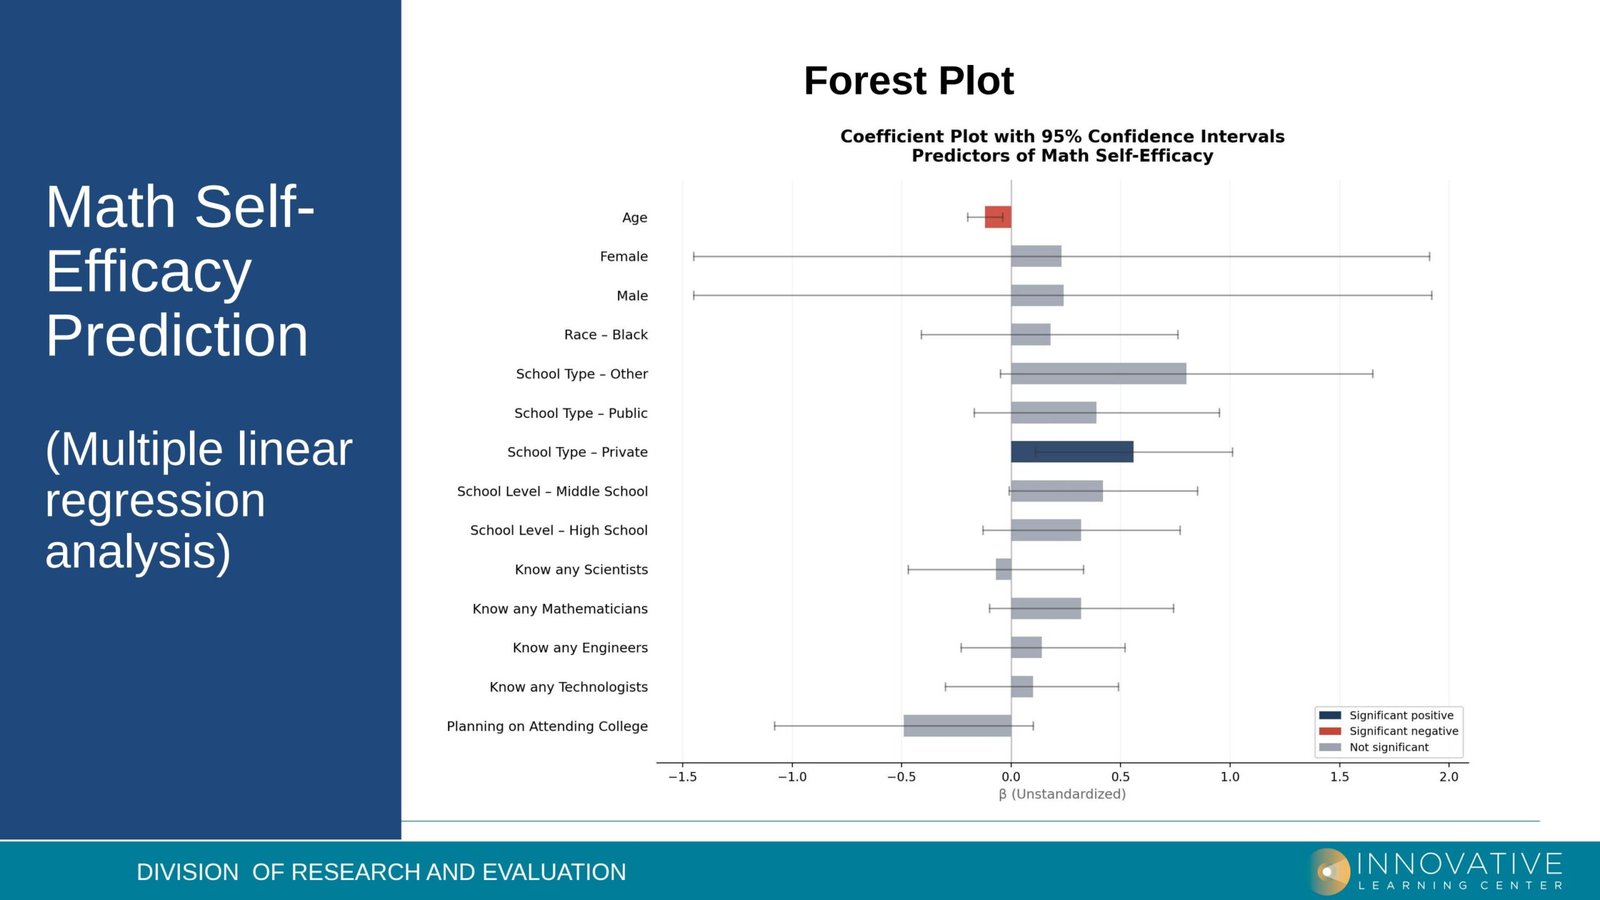
95% confidence interval plot for predictors of math self-efficacy.
Bubble size represents strength of effect on student math confidence