


Transform complex program, grant, and evaluation data into clear, actionable dashboards that help leaders monitor outcomes, demonstrate impact, and make informed decisions with confidence.
We build practical, aligned, and sustainable evaluation systems that strengthen your program operations, demonstrate outcomes, and meet funder requirements.
Track key indicators that align with program goals, grant requirements, and organizational priorities.
Reduce manual reporting efforts by automating recurring calculations, visualizations, and reporting workflows.
Develop tailored dashboards that reflect the unique objectives and metrics of your organization.
Combine data from surveys, databases, spreadsheets, and reporting systems into a single reporting environment.
Provide leadership teams with high-level summaries that support strategic planning and oversight.
Create funder-ready dashboards that communicate progress and accountability.
Clear dashboards transform data into decisions.
Assess reporting requirements
Identify critical performance indicators
Review existing data infrastructure
Design dashboard architecture
Build automated reporting workflows
Develop visual reporting components
Validate calculations and outputs
A structured process for reporting success tailored to your program's goals and funding requirements.
Define organizational goals, reporting requirements, and success indicators.
Evaluate data sources, quality, accessibility, and reporting workflows.
Design dashboard structure, reporting hierarchy, and user experience.
Connect reporting systems and automate recurring processes.
Deploy dashboards and continuously refine reporting effectiveness.
Track outputs, outcomes, participation, and service delivery.
Monitor grant objectives, compliance metrics, and reporting requirements.
Provide leadership teams with strategic performance insights.
Visualize evaluation findings and outcome trends.
Communicate organizational impact to stakeholders and funders.
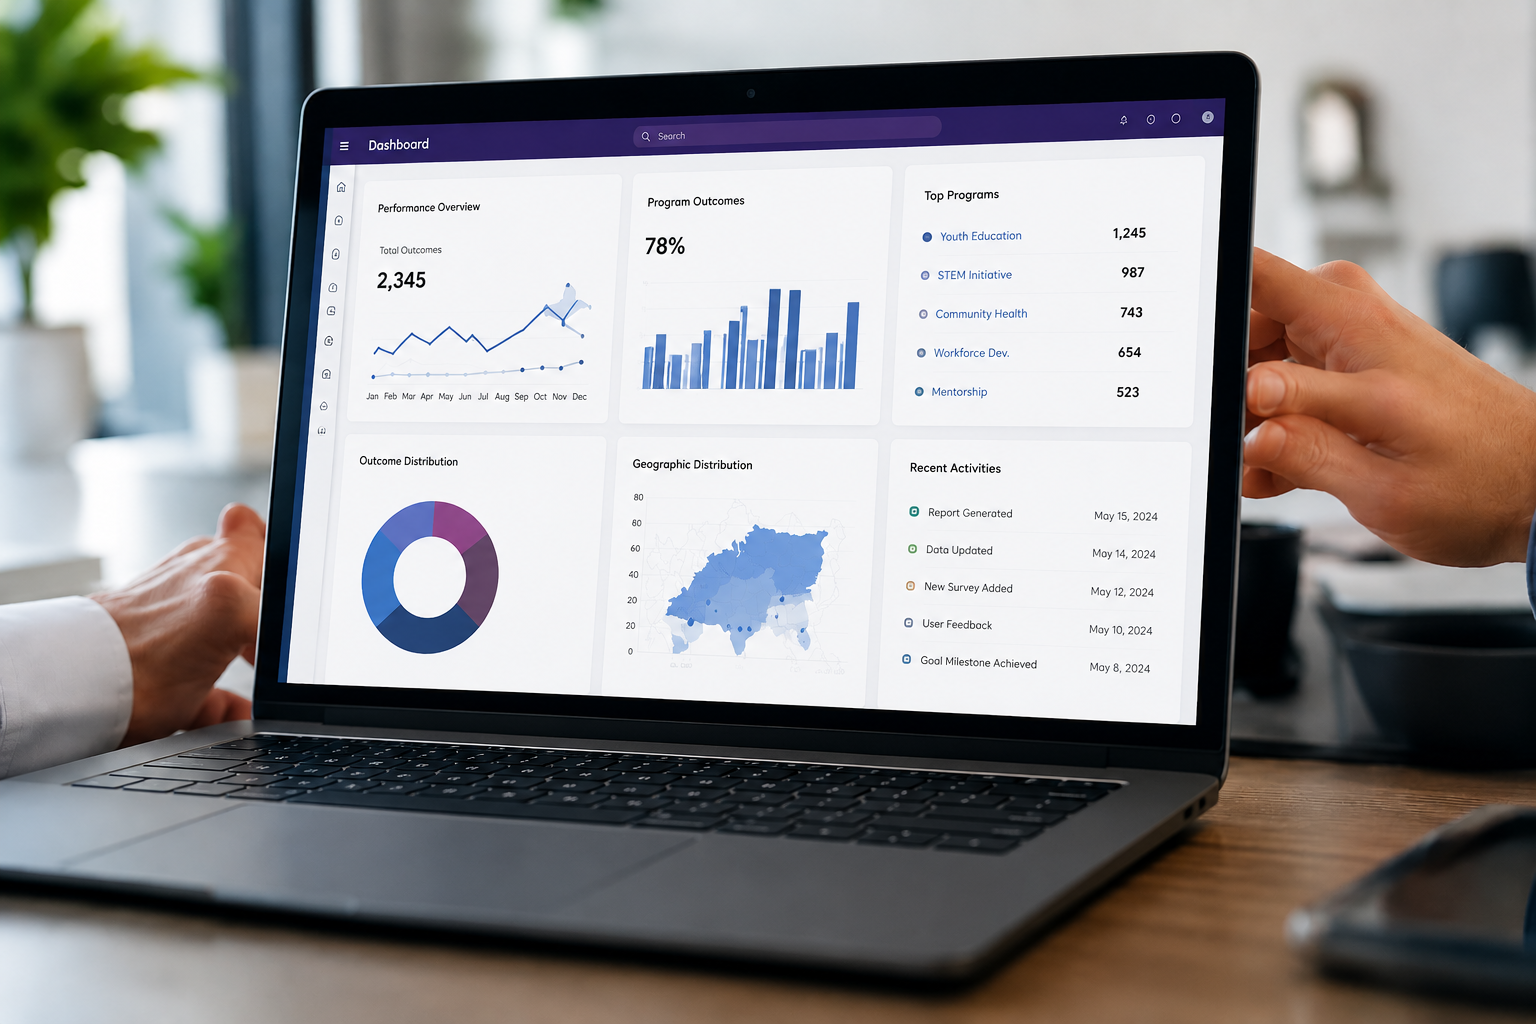
Establish structured systems that track program outputs, outcomes, and long-term impact indicators. Outcome measurement dashboards help organizations monitor progress toward strategic goals while providing evidence of effectiveness for funders, stakeholders, and leadership teams.
Monitor key performance indicators (KPIs) in real time through centralized reporting systems. Track service delivery, participation, engagement, efficiency, and organizational performance using dashboards designed to support continuous improvement.
Measure the indicators that matter most to your mission. Impact monitoring dashboards provide visibility into outcome trends, beneficiary success, program effectiveness, and community impact while supporting data-driven decision-making.
Streamline reporting requirements with dashboards designed to track grant obligations, regulatory requirements, performance benchmarks, and reporting deadlines. Improve accountability while reducing administrative burden.
Provide teams with ongoing performance visibility that supports program refinement and operational excellence. Continuous improvement dashboards identify trends, highlight opportunities, and support proactive decision-making across departments.
Align organizational strategy with measurable outcomes through executive-level reporting dashboards. Track progress toward strategic initiatives, organizational priorities, and long-term goals using clear, actionable performance data.
Leaders gain access to reliable performance insights.
Automated systems decrease manual reporting effort.
Generate data visualizations that support grant accountability.
Ensure teams focus on shared performance indicators.
Interactive business intelligence and performance reporting.
Advanced visual analytics and stakeholder reporting.
Flexible reporting systems for small and mid-sized organizations.
Purpose-built reporting environments designed around organizational needs.
Dashboard development services help organizations transform raw data into interactive visual reporting systems that support monitoring, evaluation, performance management, and strategic decision-making. Dashboards centralize information from multiple sources and present key metrics in an easy-to-understand format.
The most effective dashboards include KPIs that align with organizational goals, program objectives, grant requirements, and stakeholder reporting needs. Common metrics include participation rates, service delivery outputs, outcome measures, compliance indicators, financial performance, and impact benchmarks.
Yes. Dashboards can automate many reporting processes by integrating with existing data sources and updating metrics in real time. Automated reporting reduces manual data entry, improves accuracy, and allows organizations to focus more on analysis and decision-making.
Absolutely. Dashboards can track grant objectives, reporting deadlines, compliance requirements, performance measures, and outcome indicators. They help organizations provide funders with timely, accurate, and visually compelling reports that demonstrate accountability and impact.
Provide teams with ongoing performance visibility that supports program refinement and operational excellence. Continuous improvement dashboards identify trends, highlight opportunities, and support proactive decision-making across departments.
Align organizational strategy with measurable outcomes through executive-level reporting dashboards. Track progress toward strategic initiatives, organizational priorities, and long-term goals using clear, actionable performance data.
Turn your data into a powerful management and reporting tool through customized dashboard development services designed around your organization’s goals.